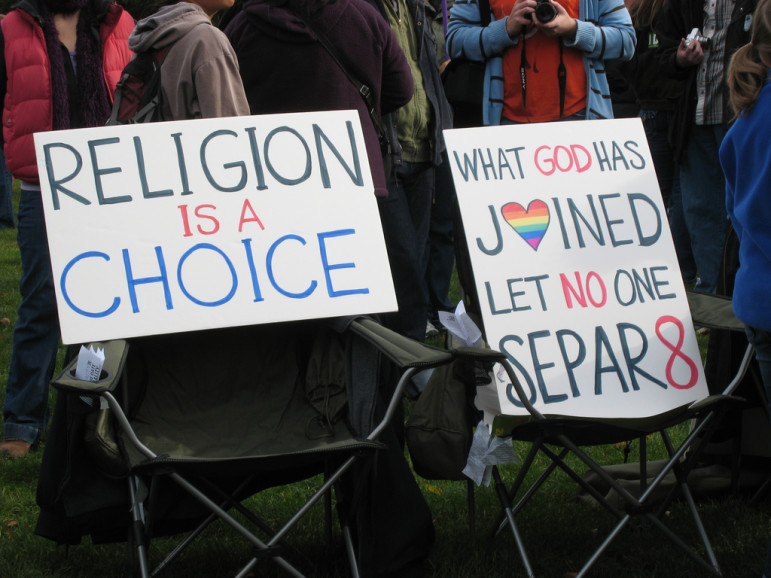
Yesterday, Pew Research Center reported on its latest poll on same-sex marriage that shows a continued religious divide. Religious folks oppose same-sex marriage, but among the so-called religious “nones,” support is almost unanimous.
Almost unanimous.
As in other surveys, Pew found 15 percent of people who are not religious oppose same-sex marriage. This is smaller than the 40 percent ten years ago, but it’s a curious little group. Why do people who eschew religion oppose gays and lesbians getting hitched?

Source: Pew Research Center surveys, report June 8, 2015.
Here are five reasons based on data from the General Social Survey (GSS). Since a handful of nones are people who are active in a religious group, but they don’t identify with a religion, I looked only at the 90 percent of nones who attend church once a year or less. Around one-in-eight of these nones opposed same-sex marriage in the latest GSS.
Here’s five reasons why some nones oppose same-sex marriage:
1. You must obey!
Most nones value individuals thinking for themselves when making decisions. But some value obedience. The GSS taps this by asking people how important certain traits are for children to succeed in life. Those who ranked “to obey” were three times as likely to oppose same-sex marriage.
2. Conservative, Republican nones
Saying that conservatives and Republicans oppose same-sex marriage isn’t surprising. But these aren’t religious conservatives. Among nones, ideology and partisanship still matter.
3. Age, but maybe not education
Another not-a-surprise: older nones are more opposed than younger nones. The impact of education is less clear. On the divide between supporters and opponents, there isn’t a significant difference between college graduates and those with less education. Among supporters, however, college graduates do hold stronger opinions than others.
4. Single, white, female supporters
There are other demographic differences. Opposition is greater among married people, racial & ethnic minorities, and men. Singles, whites, and women are each more likely to back same-sex marriage.
5. Times they are a’changing
Nones, like other Americans, are growing more supportive of same-sex marriage. In 2006, 72 percent of the nones supported same-sex marriage. By 2010, support was at 81 percent. Four years later, it was 87 percent. This fifteen point rise is independent of changes in other factors.
Geek note: Data included the 2006-2014 GSS. Each of the reasons listed were ones that were statistically significant in a model predicting opposition to same-sex marriage. This logit model including all of the variables simultaneously.
Don’t miss any more posts from the Corner of Church & State. Click the red subscribe button in the right hand column. Follow @TobinGrant on Twitter and on the Corner of Church & State Facebook page.


