


Why do American churches differ in their views of government? In previous posts, I’ve charted American churches, denominations, and religions along two broad ideological dimensions:
- Government involvement in the economy: Should government be smaller, providing fewer services, or bigger, providing more services?
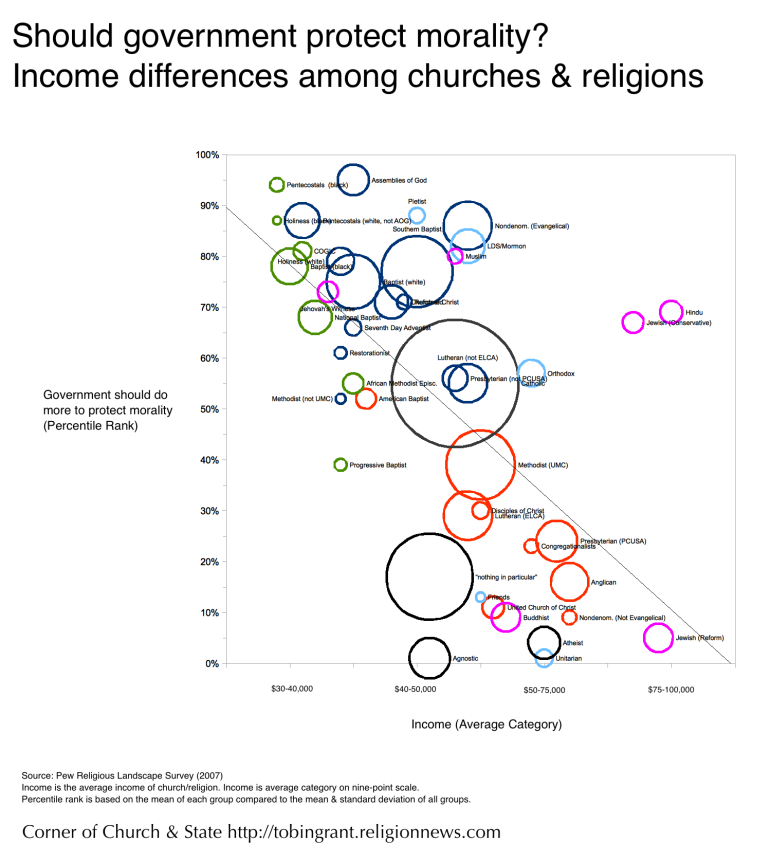
- Government involvement on social issues: Should government do more to protect morality, or is government doing too much?
Churches, denominations, and other religious communities differ on these broad questions for many reasons. Some are theological. Some are historical. Some are due to income differences or class. But how income and ideology are related may be surprising. Ironically, income is less important on economic views and is more influential on social issues.

This graphic is not offered for republication.
There is a weak relationship between the average income of a religious group and its relative position on the size of government. A key reason is the effect of race and ethnicity. Members of traditionally black denominations such African Methodist Episcopal (AME) are the most supportive of a larger government. Religious groups that have more immigrants or minority ethnic groups also prefer more government services, even though these groups have higher incomes (e.g., Jews, Hindus, and Buddhists).
Similarly, there are traditionally white churches (which still are mostly white) that prefer a smaller government despite having lower incomes. Pentecostals, holiness, and independent Baptists have about the same average income as traditionally black churches, but they hold very different views on the government’s role on economics.

This graphic is not offered for republication.
There is a much stronger relationship between income and positions on morality. The wealthier a religious group, the less it wants government to be involved in morality.
This relationship becomes even stronger if we remove three groups that are not actually religious: atheists, agnostics, and those who are “nothing in particular.” These three groups have about the same income level as Catholics and Southern Baptists but are much less supportive of government involvement on morality.
On this dimension, black and white denominations are more similar. The outliers are conservative Jews and Hindus, which are more supportive of government involvement on social issues.
There are several possible interpretations of this relationship:
- Early studies of religion by Max Weber and Richard Niebuhr as well as contemporary studies of religion find that denominations often move from being a “sect” to being a “church” (poor terminology, but ignore that). Sects are religious movements that have a high tension between their faith and the broader society. Churches are groups that are more comfortable with the rest of society. Sects are more likely to be of lower income; church groups tend to be wealthier. The differences over morality may reflect this, with more sect-like groups being both low-income and more supportive of traditional morality and high-income religious groups less concerned about government involvement in morality.
- Race and ethnicity are more important than income on the question of government services. Social scientists have noted for decades that questions of race often shape positions on government services. People often hold views like other people of their race or ethnicity despite their personal incomes. But on social issues, these racial differences are less distinct or non-existent.
- Theology matters on economic positions. Evangelicals may be more conservative on economic issues because of their theology, just as other groups are more liberal despite their high incomes.
- Populist rhetoric against elites on social issues isn’t without merit. Groups that want more government involvement on morality are those with lower income. Groups that think government should stay out of the bedroom are also the ones with the largest pocketbooks.
How to read the graph
- Each circle represents a denomination, church, or religion. There are several circles for types of Americans with no religion: self-identified “atheist”, self-identified “agnostic”, and those who say that have “no religion in particular”.
- The size of the circle represents the relative size of the religion in the United States. For very small groups, I put them in groups with other similar churches. In these cases, the circle represents collections of similar churches, e.g., nondenominational evangelicals, all Baptists who aren’t in one of the larger denominations, or all Hindus. The decision for how specific to make the circle was based on the size of the group in the survey.
- The color of the circle indicates the religious tradition of the group: evangelical Protestant (historically white), Mainline Protestant (historically white), historically black Protestant, Catholic, a catch-all category for other Christian groups, all other religions, and those with no religion. (yes, there are some disagreements about whether some groups should be coded as evangelical (e.g., Seventh Day Adventist) or even Christian or not (e.g., Jehovah’s Witness). We can debate these decisions in a future post.
- The location of the circle represents where a group’s members stand on the two major ideological divides in American politics. The numbers represent the percentile location of each group (details below). The political ideologies of religious groups are placed along two dimensions.
- Government involvement in the economy. This is the major ideological divide in the country. At one end are the “small government” folks who want a less regulation, fewer services, and more market-oriented policies. At the other are those who want a stronger safety net, tougher consumer protections, and greater checks on the economy. In the Pew survey, this is measured by a question asking whether they wanted: “a smaller government providing fewer services” or “a bigger government providing more services”
- Government involvement in morality. How much should government be involved in regulating morality? Some people believe that the government should protect morality and should uphold traditional values and religion. Others think government should “stay out of bedrooms” and keep up a high wall between church and state. This can be measured using a question that asked people to pick which statement comes closest to their beliefs: “The government should do more to protect morality in society” or “I worry the government is too involved in this issue”?
- The range of each dimension ranges from zero to 100. These scores were calculated by calculating the percentage of each religion giving each answer. The percentages were then subtracted (e.g., percent saying “smaller government” minus percent saying “bigger government”). The scores were then standardized using the mean and standard deviation for all of the scores. Finally, I converted the standardized scores into percentiles by mapping the standardized scores onto the standard Gaussian/normal distribution. The result is a score that represents the group’s average graded on the curve, literally.
Don’t miss any more posts from the Corner of Church & State. Click the red subscribe button in the right hand column. Follow @TobinGrant on Twitter and on the Corner of Church & State Facebook page.