


This graphic is not offered for republication.
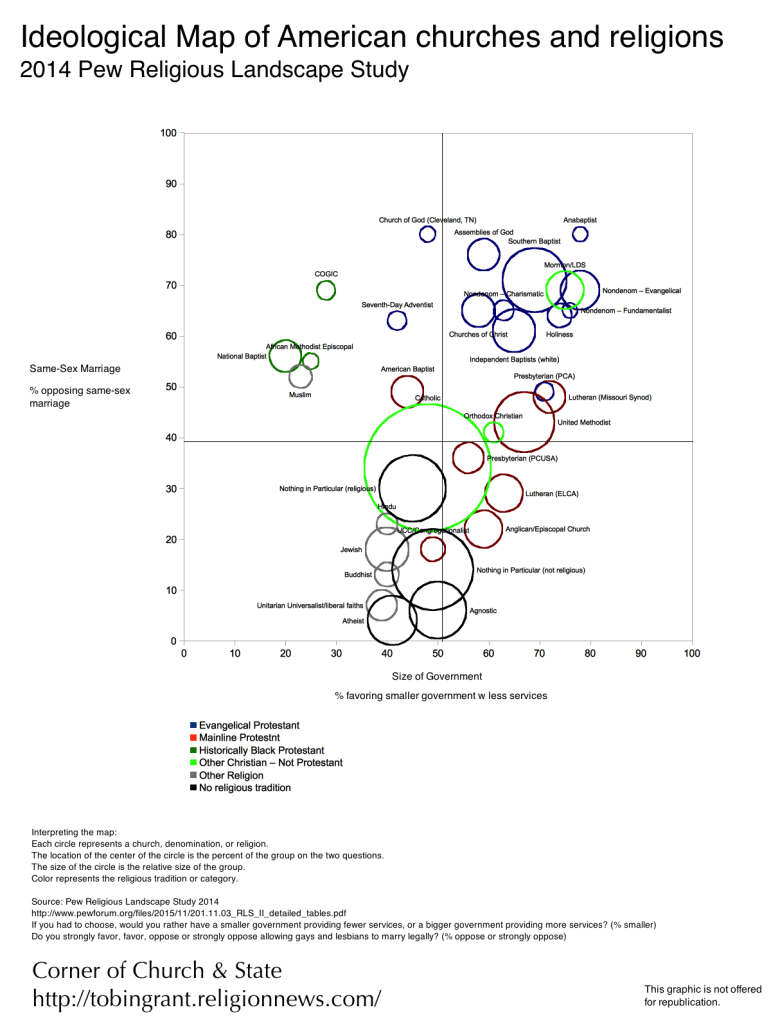
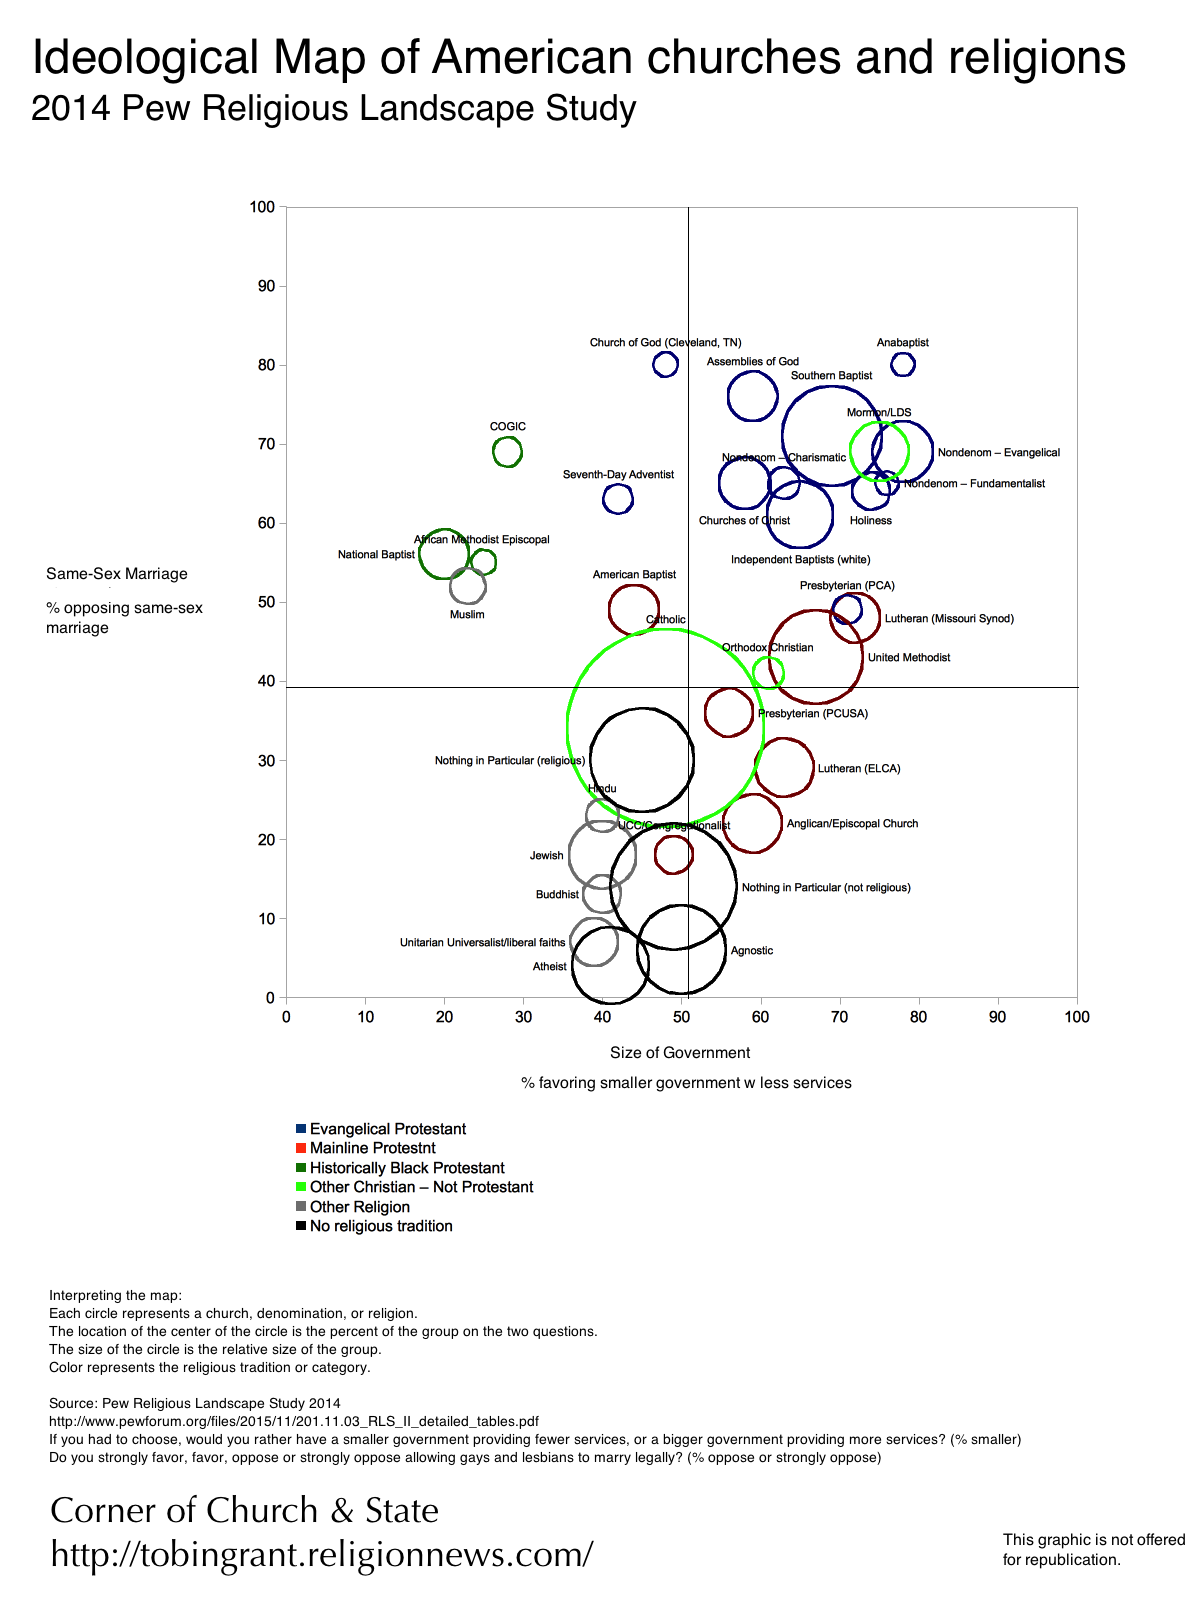
What are the political positions of religions and churches in America? This new graph maps the ideologies of American religious groups using data comes from Pew’s 2014 Religious Landscape Study.
This survey included over 35,000 respondents. It asked very specific questions on religion that allow us to find out the precise denomination, church, or religion of each person.
How to read the graph
- Each circle represents a denomination, church, or religion. There are several circles for types of Americans with no religion: self-identified “atheist”, self-identified “agnostic”, and those who say that have “no religion in particular”.
- The size of the circle represents the relative size of the religion in the United States. For very small groups, I put them in groups with other similar churches. In these cases, the circle represents a religion (e.g., Jews), denomination (e.g., Souther Baptists), or collection of similar congregations (e.g., nondenominational evangelicals).
- The color of the circle indicates the religious tradition of the group: evangelical Protestant (historically white), Mainline Protestant (historically white), historically black Protestant, a catch-all category for other Christian groups, all other religions, and those with no religion. There are some disagreements about whether some groups should be coded as evangelical (e.g., Seventh Day Adventist) or even Christian or not; feel free to gripe about that in the comments.
- The location of the circle represents where a group’s members stand on the two major ideological divides in American politics. The numbers represent the percentile location of each group (details below). The political ideologies of religious groups are placed along two dimensions.
- Size of government (x-axis). This is the major ideological divide in the country. At one end are the “small government” folks who want a less regulation, fewer services, and more market-oriented policies. At the other are those who want a stronger safety net, tougher consumer protections, and greater checks on the economy. In the Pew survey, this is measured by a question asking whether they wanted: “a smaller government providing fewer services” or “a bigger government providing more services”?
- Social issues, measured by opposition to same-sex marriage (y-axis). How much should government be involved in regulating morality? Some people believe that the government should protect morality and should uphold traditional values and religion. Others think government should “stay out of bedrooms” and keep up a high wall between church and state. The 2014 study did not report on a general question on protecting morality (as it did in 2007). Instead, I report opposition to same-sex marriage, which is arguably the most salient issue separating Americans on social issues.
- The lines in the graph represent the average American. In the study, 39 percent opposed same-sex marriage; 51 percent wanted a smaller government.
Observations from the graph
There’s a lot of information stuffed into this one graph, but here are a few key things we can see:
- Churches that are similar religiously are also similar ideologically.
- Evangelicals are classic conservatives who are to the right of the average American on both dimensions. Evangelicals have moved more conservative on the size of government since 2007.
- Mainline churches are to the right on the size of government (similar to some evangelicals). Some denominations are more supportive of same-sex marriage; others are more opposed (albeit not as opposed as evangelicals)
- Christians in traditionally black denominations are populists: they are the most in favor of a larger government and opposed to same-sex marriage.
- Catholics represent the center on both dimensions.
- The “nones” are distinct in their strong support for same-sex marriage, but they are in the middle on the size of government.
Don’t miss any more posts from the Corner of Church & State. Click the red subscribe button in the right hand column. Follow @TobinGrant on Twitter and on the Corner of Church & State Facebook page.