
We are in the midst of the “Great Decline of Religion” in America. In a previous post, I showed in one graph thousands of survey results. But here are just five measures of American religion reported annually by Gallup that each show the same thing: religion in America is on the decline.
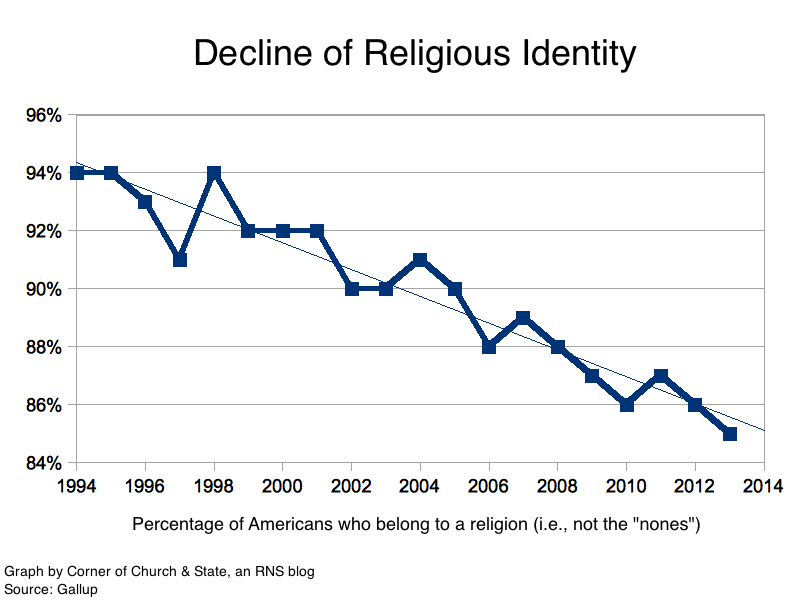
One of the most important measures is the rise of the so-called “nones.” This is the growing segment of Americans you say “none” when asked what their religion is. Two decades ago, only one-in-twenty Americans said they weren’t part of any religion. Today, it is at least three times that level, with the “nones” becoming one of the largest religious groups in the country.

It’s tough to get Americans to accurately report whether or not they attend church. Regardless, even a measure that may over-report attendance is showing a decline. This graph shows the percentage who report attending more often then “seldom” or “never” (so, once a month or more). The average has moved from the low-60 percentages to nearly 50 percent (a twenty percent drop).
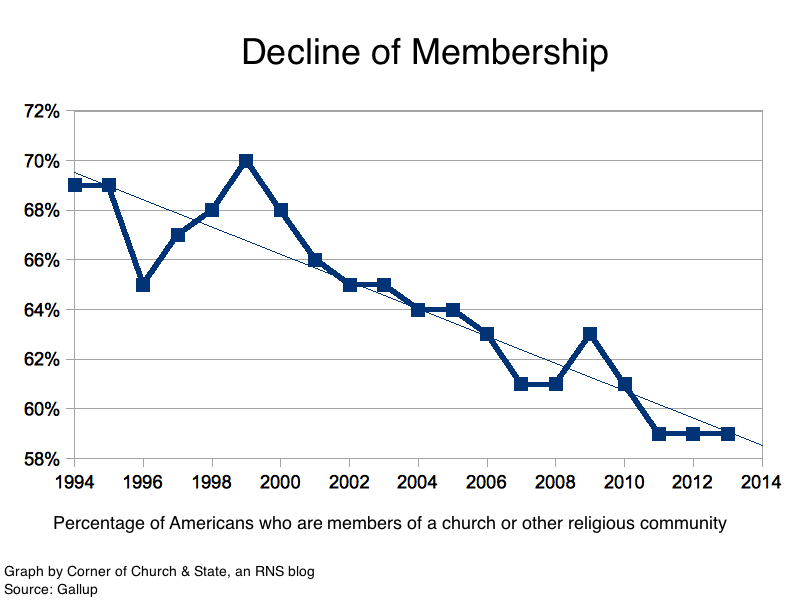
Both the decline in people identifying with religion and attendance is related to membership. Even people who never attend church may be a member of a religious community. Twenty years ago, seven-in-ten Americans said they were members of a church or other religious group. Today, it’s less than six-in-ten.
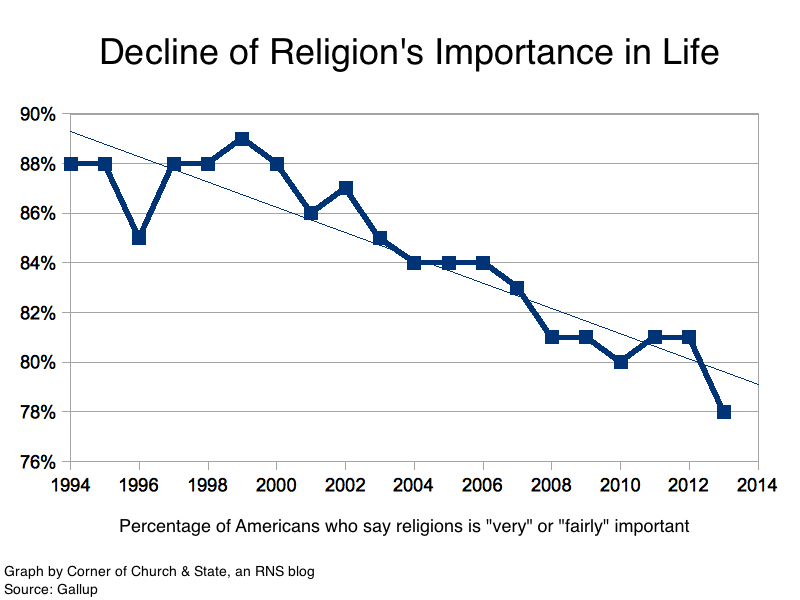
Ok, so maybe it’s not a decline of religion per se but a decline in “organized religion.” Gallup and other pollsters get around this by asking about how important religion is people’s lives. As with the other measures, this measure of religion is moving downward. It, too, has dropped about ten points since the early 1990s.
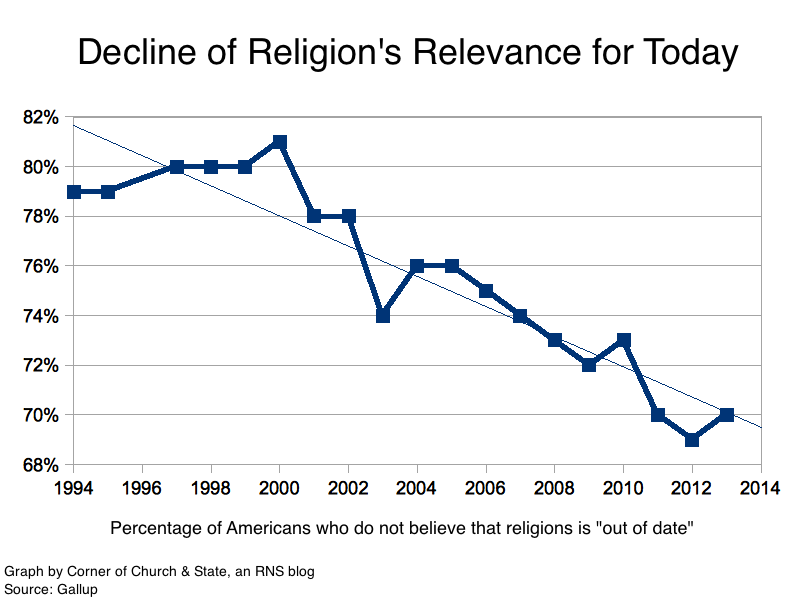
How about this measure: is religion relevant for today’s problems or is it out of date? The percentage of people who think religion is relevant for today is down from 80 percent to 70 percent.
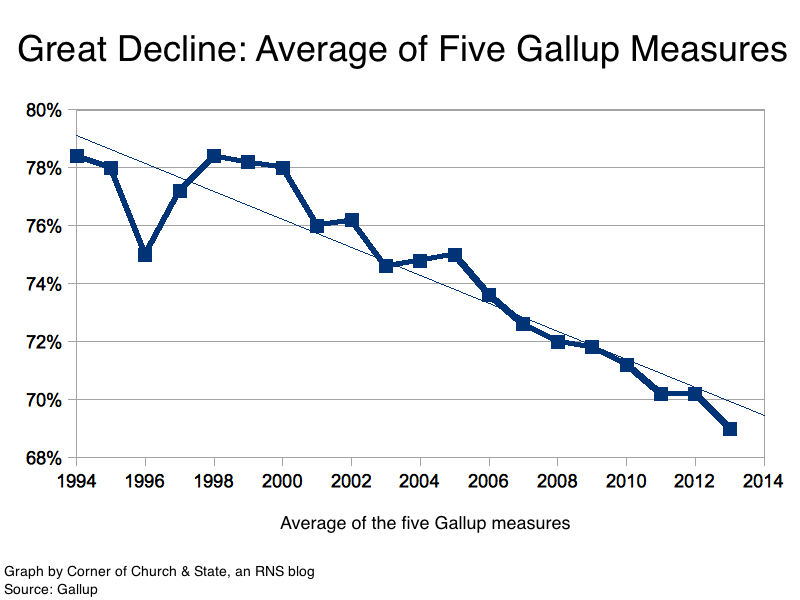
There are more sophisticated ways of combining these measures, but here is combination that puts them into one graph. This is simply the average of all the measures for each year. In the early 1990s, this average was hovering around 78 percent. From 2000 onward, the measures have been in decline, reaching 69 percent last year.