This graphic is not offered for republication.
Readers of this blog sometimes question data on religion if it is more than a year or so old. This is to be expected. We are used to news stories on changes in public opinion. But when it comes to religion, change happens very slowly. Even the recent rise of the nones and other drops in religiosity are, compared to other demographic changes, relatively slow. People are much more likely to change their opinion on political issues than they are to change their religious faith.
Changes in religion are slow because they are driven by demographic changes. Faiths with larger families tend to grow; those with fewer kids don’t keep up. The religion of immigrants will grow more than the religion of emigrants.
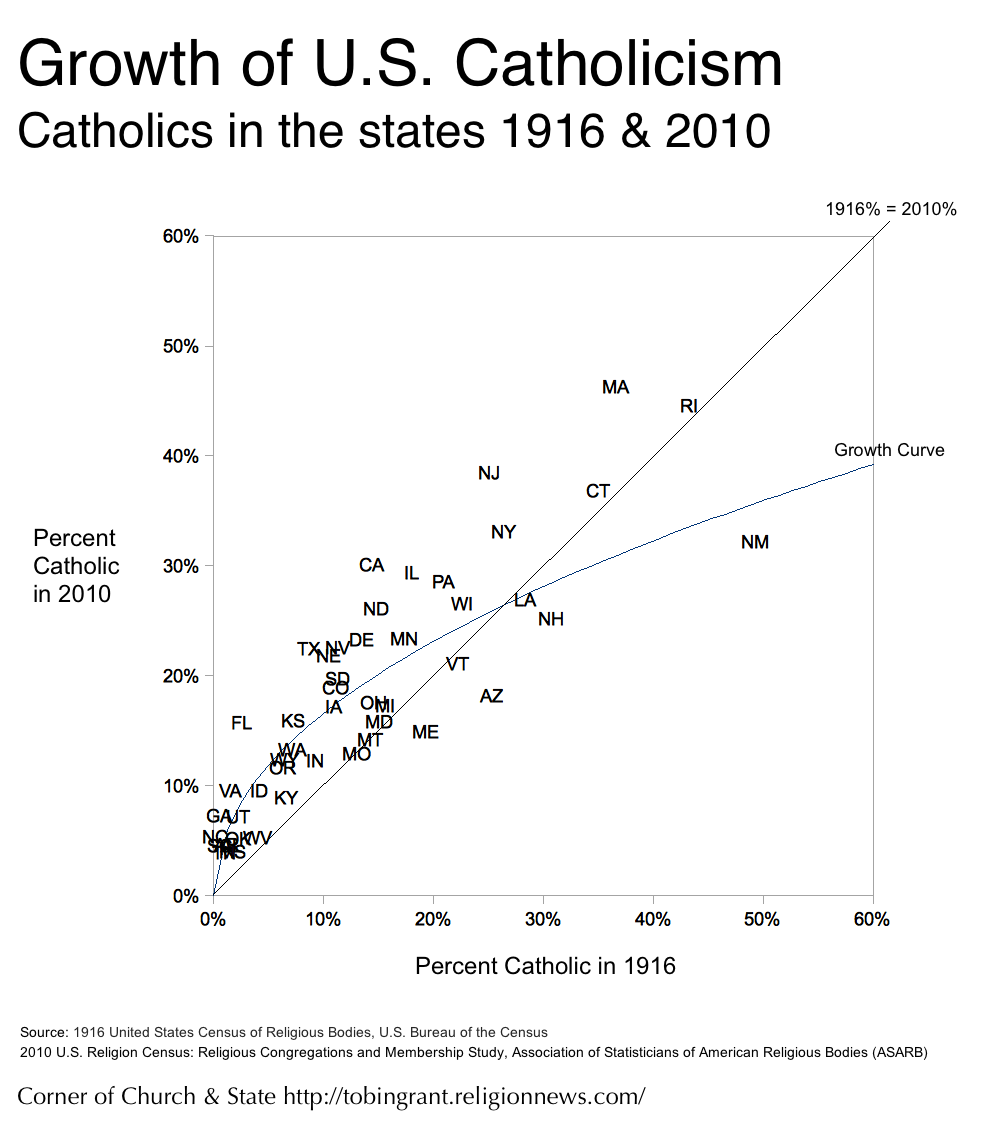
Catholicism is a good example of this slow growth and geographic stability. We can chart the growth of Catholics by comparing recent surveys of churches with those from a century ago. The U.S. Census used to conduct surveys of churches to find out how many members they had. It tracked churches in 1906, 1916, 1926, and 1936. Today, a similar accounting of church membership is conducted by a private organization, the Association of American Religious Bodies (ASARB). It’s most recent survey in 2010 included 236 religious organizations, churches, and denominations.
What do we see? One the one hand, there has been growth. Catholics have increased their “market share” in nearly every state over the past century. On the other hand, the states that were the most Catholic a century ago are still heavily populated by Catholics today. Where there has been growth, it can be traced to migration (both within the U.S. and from abroad).
In the chart, the diagonal line represents the points at which the 1916 percentage and 2010 percentage are equal. All of the states above the line have more Catholics (as a percentage of their population) than in 1916. Catholics make up a smaller share of their state in only a handful of states, and only four—Arizona, New Mexico, Maine, and New Hampshire–had reductions well over five percent. In these states (and the few others with more modest losses) there were significant Catholic ethnic or regional groups in 1916 (e.g., former Mexicans, Quebecois, and Cajuns). These states have seen growth in non-Catholics due to migration. Arizona and New Mexico have changed from being small (recently added) states to ones having large metropolitan areas populated by former residents of the Midwest and Northeast.
The greatest rate of growth has come in the South. In 1916, North Carolina, South Carolina, Georgia, Florida, and Virginia each had one percent or less of their population who were Catholic. Today, Catholics are still a small minority in these states, but they make up far more of their state than previously.
Amidst all of this growth, the geographic distribution of Catholics is not much different today than it was one hundred years ago. In 1916, the states with the largest Catholic population (as a percentage) were:
- New Mexico
- Rhode Island
- Massachusetts
- Connecticut
- New Hampshire.
Today, the top-five are still in the Northeast:
- Massachusetts
- Rhode Island
- New Jersey
- Connecticut
- New York.
Similarly, the states with the lowest Catholic populations are still states in the South: Tennessee, Mississippi, Alabama, South Carolina, and Arkansas.
When there is greater than expected growth, it is due largely to migration. Florida’s Catholic population has risen because it has attracted immigrants from Latin America, Cuba, and the Northeast. California’s growth has included large numbers of immigrants from Mexico and Central America. The growth of Catholics in southern states isn’t due to mass conversion (pun unintended) but immigration of Catholics from other parts of the nation and from abroad.
Religion changes slower than other parts of society. The southern states used to be one-party states in which only Democrats could win. Today, they’re solidly Republican. Regions that used to be rural are now part of suburban sprawl. States along the Great Lakes have become a “rust belt”; states from Arizona to Florida have grown as part of the “sun belt;” but there’s still the same “Bible belt” that there was a century ago. The states that were home to large Catholic populations decades ago are still Catholic today, and the states that weren’t still aren’t. There’s growth, but it’s slow.
Don’t miss any more posts from the Corner of Church & State. Click the red subscribe button in the right hand column. Follow @TobinGrant on Twitter and on the Corner of Church & State Facebook page.