According to the U.S. Census, the U.S. spent $3.6 billion constructing religious buildings last year. This was the lowest in twenty years. It is also sharply lower than the apex of a decade ago.
Here are three graphs that show the boom and bust of religious construction.
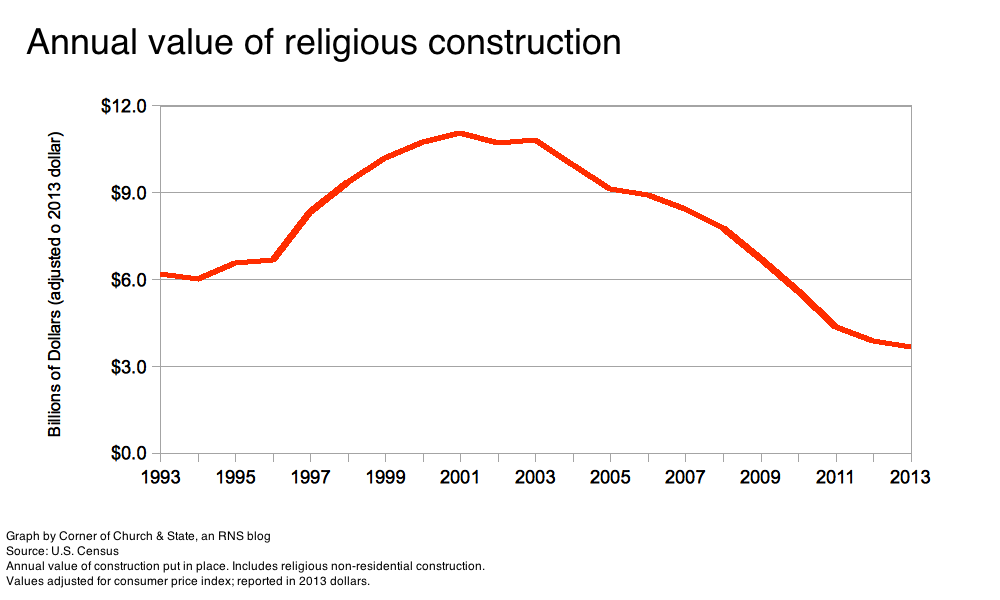
This graphic is not offered for republication.
Construction on religious buildings in 2013 was the lowest in two decades of data. From 1994 to 2001, the value of religious construction nearly doubled. After remaining steady near $11 billion, religious construction has dropped steadily over the past decade to the current low of $3.7 billion.
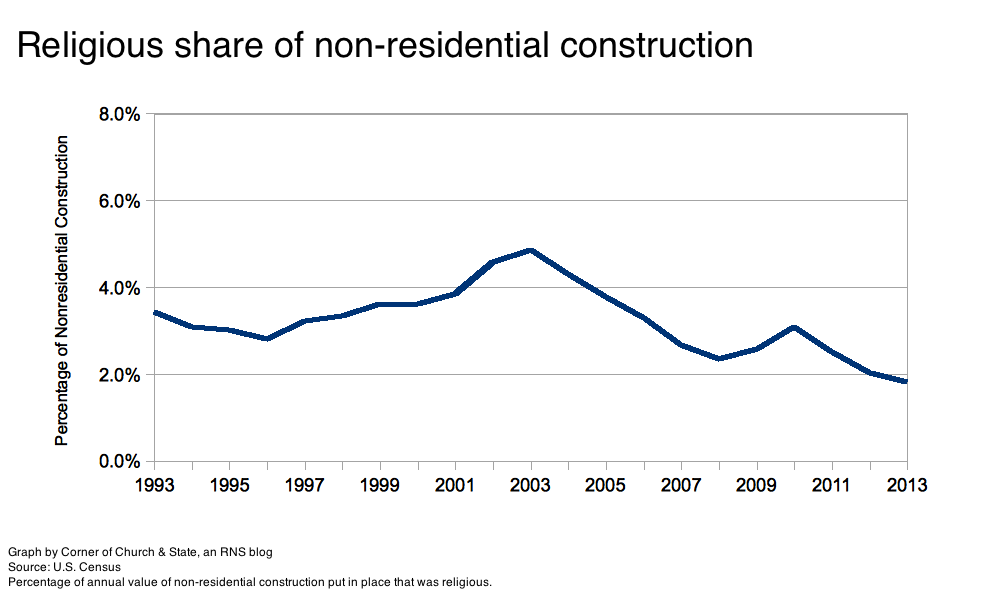
This graphic is not offered for republication.
Building churches is a small part of a larger sector of non-residential construction. This sector has its own up’s and down’s. We can take these into account by seeing how religious construction changes as a percentage of the broader non-residential sector.
Some of the increase in the value of religious construction was part of a broader growth in construction. However, this is not the whole story. Religious construction grew as a percentage of nonresidential construction during the late 1990s. The peak occurred in 2003 when churches were 4.9 percent. Last year, religious constructions were only 1.8 percent.
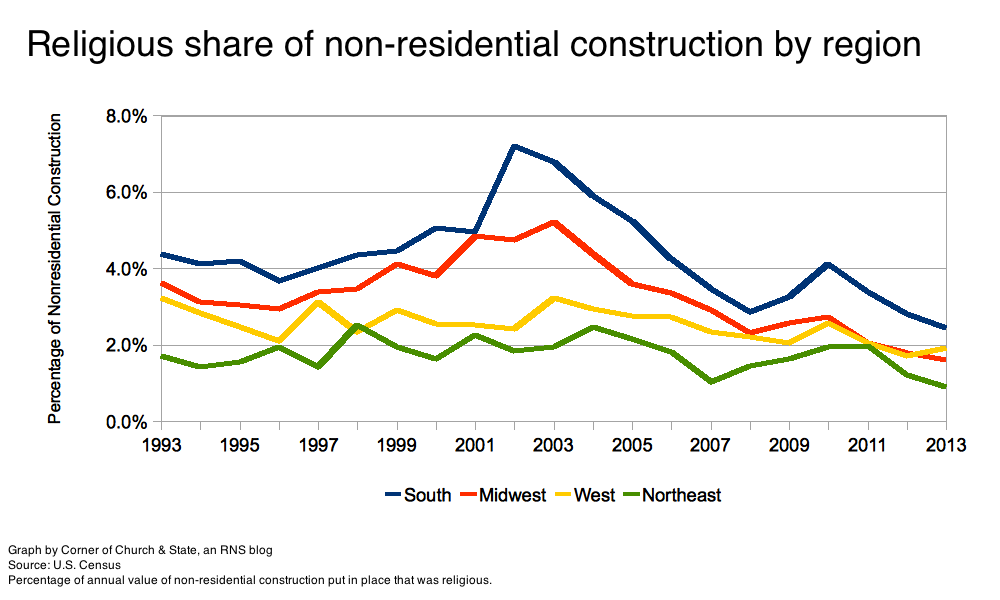
This graphic is not offered for republication.
The changes in religious construction varied by geographic region. The greatest rise (and fall) occurred in the South and the Midwest. In the southern states, religious construction made up 7.2 percent of nonresidential construction in 2002; last year it had dropped to 2.4 percent. For the West and Northeast, religious construction is down, but there was not the same level of boom or bust found elsewhere.
The line for western states actually masks one important change. There has been a substantial drop in the Pacific region (CA, OR, WA, AK, and HI). Last year, religious construction was only 0.8 percent of the nonresidential sector in this region. Ten years ago, it was four times that.
Geek Note: The U.S. Census has been tracking construction values since 1964. We cover the past two decades because in 1993 the Census changed how it tracked this sector of the economy. Religious construction includes two types of structures: houses of worship (e.g., churches, synagogues, etc.) and other buildings used for religious activity (e.g., convents, fellowship halls, etc.).
Don’t miss any more posts from the Corner of Church & State. Click the red subscribe button in the right hand column. Follow @TobinGrant on Twitter and on the Corner of Church & State Facebook page.