US Mormons are becoming less Republican, but not by much
(RNS) — Earlier this month, leaders of The Church of Jesus Christ of Latter-day Saints issued an unprecedented statement about the dangers of voting a straight-party ticket. “Merely voting a straight ticket or voting based on ‘tradition’ without careful study of candidates and their positions on important issues is a threat to democracy and inconsistent with revealed standards,” the First Presidency wrote to members in the United States.
Since Latter-day Saints (Mormons) in this country have a decades-long history of voting Republican, the “tradition” church leaders appear to be challenging is the all-too-common default setting of conservative church members voting for whichever candidate has an “R” next to their name.
What’s surprising about this is that half a century ago, it was a church leader who infamously suggested that nothing short of a wholehearted embrace of the GOP would suffice for church members. As then-apostle Ezra Taft Benson controversially stated in 1974, a good Mormon could not be a Democrat. Although Benson was privately rebuked for it by the prophet at that time, Spencer W. Kimball, the damage was done: Many older U.S. Mormons still seem to assume that “GOP” stands for “God’s Own Party.”
But the reality is that Mormons in America have become less Republican over time. However, it’s less of a blue wave than it is a blue ripple.
Drawing from Cooperative Election Study national data from 2008 to 2022, sociologist Ryan Burge has created the following graph of Mormon partisan affiliation over time. (Note: Each party’s numbers include some “leaners” who identify as independent but say they lean more toward one party or the other.)
As you can see, there is a range of Republican affiliation, from the high-water mark of 75% GOP affiliation in 2012 (thank you, Mitt Romney!) to the nadir, which was 53% in both 2017 and 2021 (thank you, Donald Trump and Jan. 6 extremists).
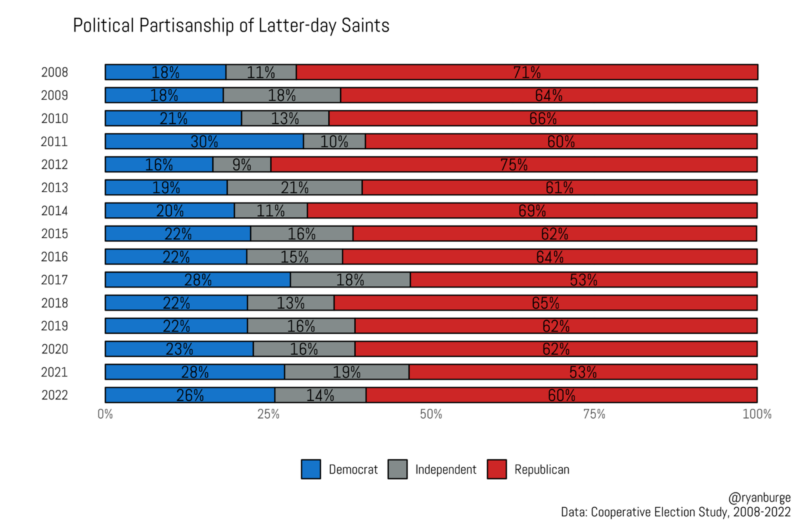
LDS political partisan affiliation, 2008 to 2022, Cooperative Election Study as analyzed by Ryan Burge. Image courtesy of Ryan Burge
One thing to keep in mind with this data is that odd-numbered years in the CES survey have a much smaller sample size, so the total number of LDS respondents in 2017 and 2019 (273 and 293, respectively) is less than half what it can be in election years (e.g., 870 Mormons in 2016 and 764 in 2020). This means that results from even-numbered years are somewhat more reliable.
To offer a more user-friendly perspective, I compiled the CES data into three five-year blocks, averaging the LDS respondents’ political affiliation from 2008 to 2012, 2013 to 2017, and 2018 to 2022. This approach creates comparison groups with larger sample sizes, smoothing out some of the year-to-year fluctuations that are more likely with the smaller sample sizes in individual surveys. The chart below compares the first and last blocks of years, comparing the 2008 to 2012 period to partisan affiliation ten years later.
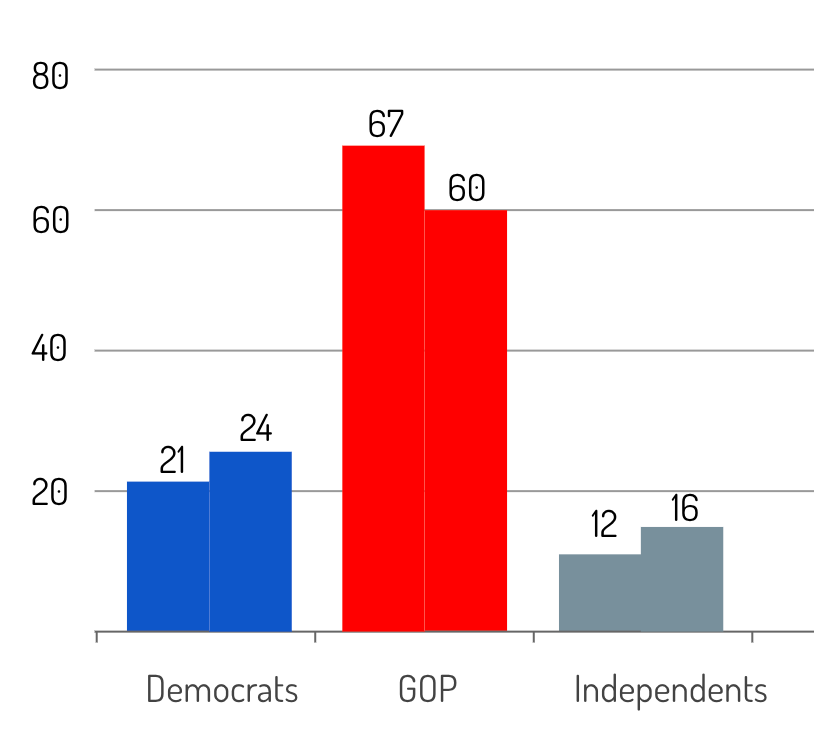
LDS political shift from the 2008 to 2012 period and the 2018 to 2022 period. Cooperative Election Study as analyzed by Ryan Burge; Graph by Jana Riess
The main takeaway is that there have been modest GOP losses of about 7 points overall. However, this hasn’t been a slam-dunk for the Democratic Party. Democrats appear to have gained only 3 points, while independents gained 4.
The biggest losses for LDS Republicans have come among the younger generations. Here’s an additional graph that Burge created of the even-year CES data, but broken into seven different cohorts by birth decade.
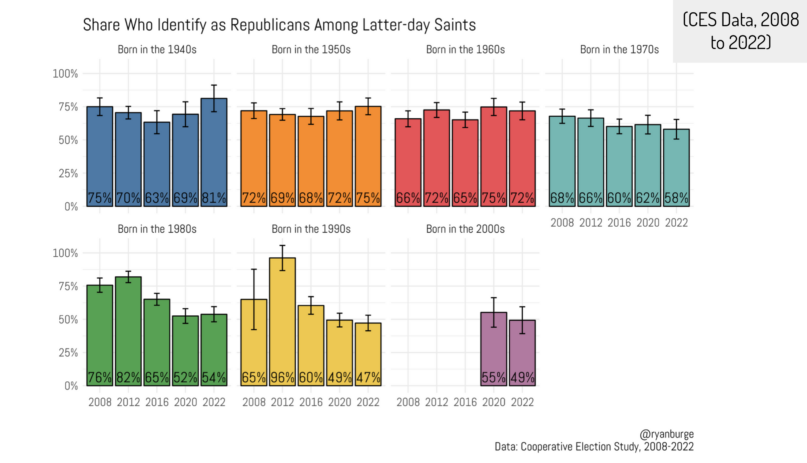
LDS Republican identification by birth decade. 2008 to 2022, Cooperative Election Study as analyzed by Ryan Burge. Image courtesy of Ryan Burge
What we see across the board is that each cohort’s level of Republican (and Republican-leaning) identity takes a hit in 2016 compared with 2008 and especially compared with 2012, when Romney was the GOP presidential nominee. But for older Mormons, Republican identity bounces back, so any Trump disaffection appears to be a temporary blip.
Not so for the generations born in the 1980s and later, whose GOP affiliation took that same hit in 2016 but then kept on declining.
So if there’s a silver lining for Mormon Democrats, it’s that younger people appear to be turning away from the Republican Party in a more enduring fashion, at least up to now.
The CES data resonates with recent generational findings from the 2022 Wave 2 of the Next Mormons Survey, which Benjamin Knoll and I are currently analyzing.
When we first conducted Wave 1 of the Next Mormons Survey back in 2016, we noted a stronger preference for the GOP among older U.S. Latter-day Saints. That was still true in 2022 as well, with a full 93% (!) of Silent Generation respondents embracing the Republican cause. Not one of the survey’s 49 Silent Generation respondents identified as a Democrat.
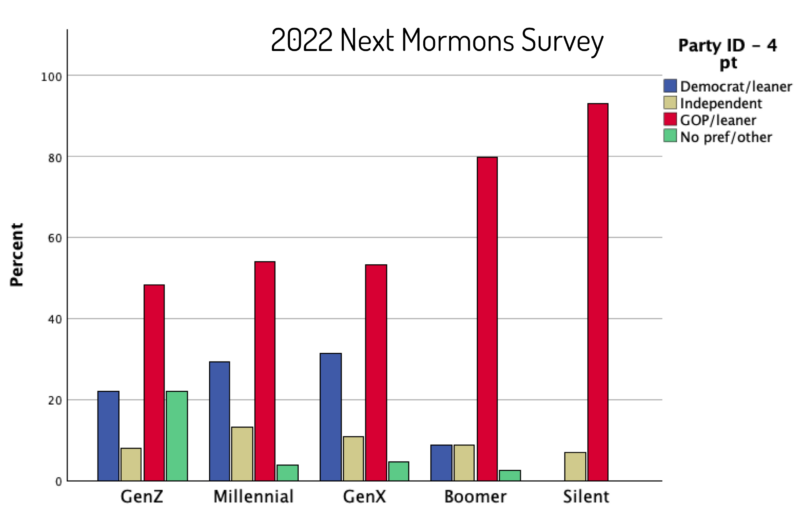
LDS political affiliation by generation, 2022 Next Mormons Survey. Graph by Jana Riess
That’s a small sample size from which to draw conclusions, but the finding tracks with previous research about older Mormons’ political conservatism. The Silent Generation, born through 1945, were adults in the Ezra Taft Benson era, when LDS political conservatism had become a given. We also see strong GOP identification among the 229 baby boomers in the NMS2 (born 1946 to 1964), 80% of whom identified as Republicans.
It’s between baby boomers and Generation X that we see the largest drop: The GOP is 53% of Gen X (n=197), 54% of millennials (n=265) and 48% of the youngest respondents, Gen Z (n=91).
But again, this isn’t a wave but a ripple. In the second Next Mormons Survey, we see the Democratic Party also bleeding a bit among its younger LDS adherents, with about 3 in 10 Gen Xers and millennials, but only 1 in 5 among Gen Z. In fact, there are as many people in Gen Z who say they have no political preference as report being Democrats.
It will be interesting to see whether the church’s statement against straight-party voting does anything to soften older Saints’ apparent sense that to be a faithful Mormon means to fully align with the Republican Party. Frankly, I doubt it. The last several years have brought us an abundance of social science research indicating that many Americans’ political identities have become more powerful to them than even their religious identities.
But among younger U.S. church members, the GOP’s lock seems to already be weakening.
Related content: